Elev8 Solutions

The Rise of the Citizen Data Scientist
Ulrik Carlsson, Microsoft MVP | Sr. Solution Architect and Readiness Expert
Machine learning, artificial intelligence, and predictive scoring are just some of the buzzwords flying around the data science industry these days. All of them are based around the idea that machines and algorithms are able sift through the massive amounts of data that we are collecting on our business, sales processes, services, etc. and give us recommendations and insights into what to do next. According to Gartner, 40% of data science tasks will be automated by 2020.
This is actually far from a new concept. In my first IT job as a CRM administrator at the Scandinavian headquarters for one of the largest software companies in the world, we used an artificial intelligence feature for one of our enterprise solutions referred to as “neural networks”. The benefits of using these neural networks then was very similar to the benefits of using machine learning and AI in our business systems today. That was 17 years ago and the cost of entry for getting these insights was astronomical. It was so difficult to get your processes and data into a state of maturity to take advantage of these features, that few ever did. Even after almost two decades of working with CRM systems, machine learning and the AI insights have remained elusive.
Machine learning delivers AI to the enterprise
It can be argued that back in 2000, using AI in enterprise or business applications were a premature technology. Sure, the math to perform the calculations was there, but the supporting software, hardware, and not to mention the people - were not. For a flashback there’s an article from Forbes published the summer of 2000 claiming that AI is all hype. Turns out they were right at the time, but all that was about to change.
Recently, services like the Azure Machine Learning Studio (Azure ML) have made the barrier to entry significantly lower from a technical perspective. There’s still, as mentioned, a human component that needs to catch up. Tools like Azure ML makes it possible for most people to add data to a machine learning model, work with training and test data, apply it as a service, and see some actual results.
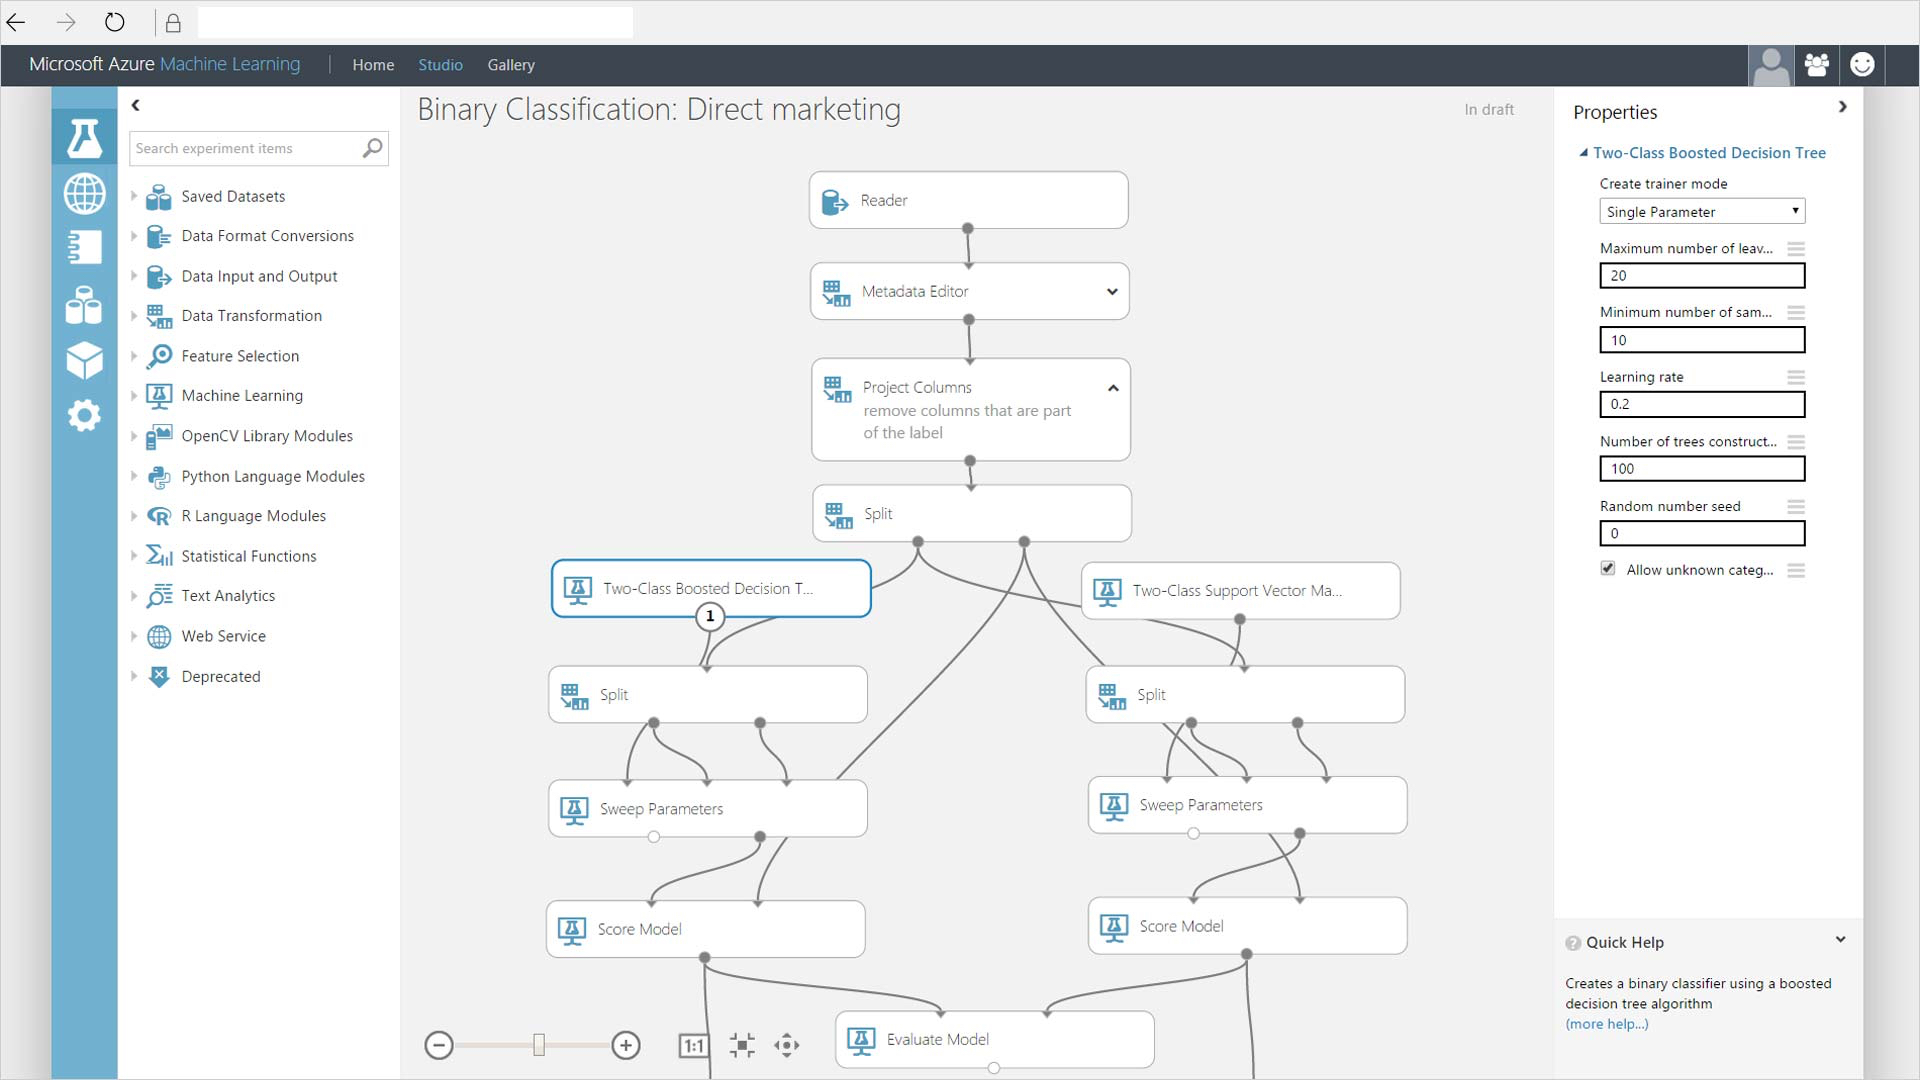
Data scientists and those who have worked with machine learning in the past can’t stop talking about how easy it is to use. However, you do need to have a solid understanding for how machine learning actually works in order to get the right results. For example, will you pick a multiclass logistic regression, or a multiclass neural network to predict which services your customer might choose. There’s a reason the data scientists are called data scientists. Scientist is the key term in that title. Few would probably label themselves a chemist just because they have access to a lab or saw Breaking Bad on TV.
Who is a Citizen Data Scientist?
A data scientist’s work includes a great deal of research, testing and fine tuning models, and a passion for selecting the proper algorithms for answering the questions you have at hand. While the barrier to entry may have lowered significantly, the considerations on what to do with your data and how to properly apply machine learning have not, and it is likely keeping a lot of people from venturing into that world. After all, only few organizations today actualy employ data scientists to handle these critical tasks. While Microsoft has already made machine learning significantly more approachable to a wider user base, they are about to change the game again and bring about the rise of the “Citizen Data Scientist”.
As defined by Gartner, the Citizen Data Scientist is a person who creates or generates models that use advanced diagnostic analytics or predictive and prescriptive capabilities, but whose primary function is outside the field of statistics and analytics.
The Citizen Data Scientist is not like the controversial Citizen Developer, which actual developers have a complicated relationship with depending on how much messy code or broken features they must clean up after someone without the proper knowledge tried to develop something in their system. I consider the Citizen Data Scientist to be exclusively a good thing, and the reason for this is Microsoft’s new Azure service called Customer Insights.
Customer Insights driven by Microsoft Azure
Customer Insights allows administrators and those in similar roles to replicate their Dynamics 365 customer engagement data, data from social media via Social Engagement, along with other sources to a database in Azure. It is worth paying attention to the fact that Customer Insights is based on a graph database; graph databases are a huge topic in itself, but the relevance here is that graph databases are designed to help model and explore a web (or graph) of relationships in a more natural and productive way. A common query in graph databases could be to find all objects or activities related a customer two links away. As a user of Customer Insights, you fortunately do not need to know about graph databases. The interface handles this for you, but it is good to know that your data is stored in a model that is designed specifically for what you want it to do.
With Customer Insights, the Citizen Data Scientist is now able to use tools like Predictive Scoring to create advanced machine learning models simply by stating two outcomes. For example, predict the risk of a losing a given customer and create a list of the top signals that predicts loss. All the Citizen Data Scientist would have to do is tell Customer Insights which accounts were lost and which were retained. In Microsoft Dynamics 365, that could be as simple as specifying Accounts of the type Customer for the positive outcome, and Accounts of the type “Lost” for the negative outcome. Customer Insights will then go through all the data regarding the Accounts, look through all the related data up to two levels out. So, not just records directly related to the customer, but also who managed the service cases for the account.
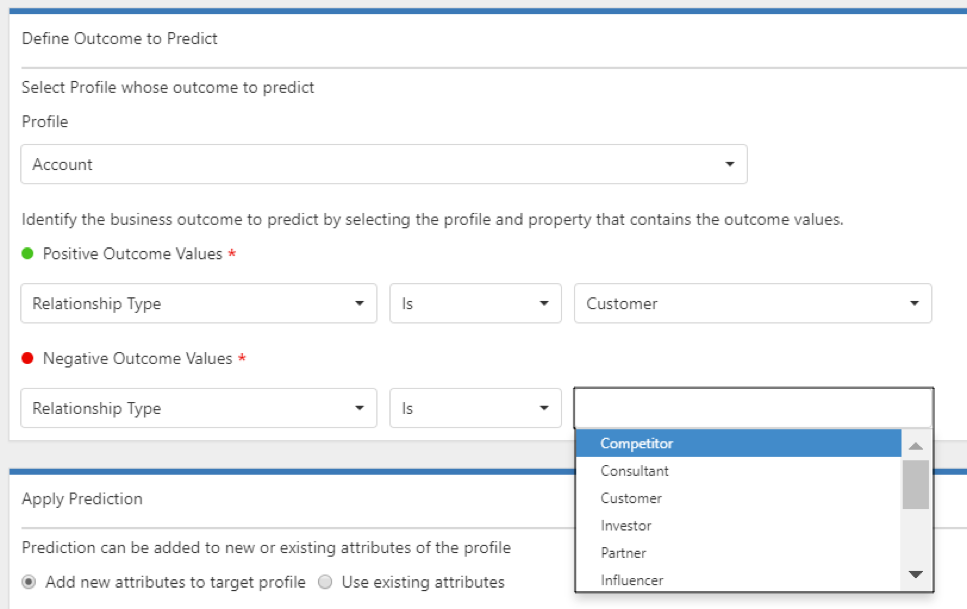
As a result, the Citizen Data Scientist will be given a score for each customer of what the risk of churn is along with a list of the top signals that indicates a churn is coming. Those signals could be a decrease in communication, fewer orders, worse ratings, etc. All that was needed was asking the question and defining the positive and negative outcome. No need to worry about selecting either two-class Bayes point machine or the two-class logistic regression algorithm for your model. Customer Insights will select the right algorithm for you. In addition, Customer Insights will also figure out which data is relevant to include, so you don’t have worry about what to include in your data set. The task in the future will be to ask these questions and specify outcomes - not worrying about selecting the correct algorithm, selecting the right data for training your model, or the right data set for testing the model.
Together, we rise
While I did say that the Citizen Data Scientist was exclusively a good thing, there is an obvious question and concern. How will this everyday business user stack up against a real data scientist? Only time will tell on the exact results, but given the information currently available, a data scientist who invests the time needed could likely improve scores by a percentage point or two. Of course, this assumes you have access to a real data scientist to begin with.
The Citizen Data Scientist is clearly cheating in this matchup by simply piggy backing on Microsoft’s team of data scientists. The results generated from Customer Insights will only improve over time and begin to close this gap. The type of insights and data intelligence that was so fascinating, yet highly elusive to me 17 years ago is about to become mainstream and something we can all take advantage of. With Customer Insights, Microsoft is enabling all of us to become a Citizen Data Scientist and even smaller businesses can take advantage of machine learning in a manner that until recently has been reserved only for a very exclusive club.
About Ulrik
Ulrik is a Senior Solution Architect and Readiness Expert at Elev8 Solutions and Microsoft MVP. He known around the world for his wildly popular blog “The CRM Chart Guy”, Ulrik’s blog focuses on something in which Elev8 deeply believes – making the very most out of the native functionality already available within Microsoft Dynamics CRM and Dynamics 365. Ulrik is a respected thought leader and expert when it comes to business intelligence and data visualization, as well as a world-class trainer regarding Microsoft Business Solutions. Visit The CRM Chart Guy Blog.
Resources
How to choose machine learning algorithms for Microsoft Azure Machine Learning
Downloadable Infographic: Machine Learning Basics with Algorithm Examples

CRM MVP: Finding the Right Partner
"This is not what we thought we were going to get."
That statement is heard in many Microsoft Dynamics 365/CRM deployments, and most of the time, it is on the negative side. This is either because the customer expected a different process or team dynamic during the deployment, or the business objectives the customer had at the beginning of the deployment are not being met. Regardless of the reason, finding and working with the right partner is the most critical factor that can affect the success of a project or deployment.
In Episode 2 of the CRM MVP Podcast, 5x Microsoft MVP and Elev8 Solutions CEO Gus Gonzalez discusses how important it is to find the right partner, the most popular reasons why some CRM deployments fail, the 3 things you need to know when selecting a partner, and how to find the right partner to work with.
Top 3 CRM MVP Rules for finding the right partner:
- Avoid white board Consultants.
If you are having conversations with a partner who simply says "Yes, we can make that happen" to everything you ask for, it might feel right at first, but it will always come back to haunt you. You need to work with an organization who can leverage all of their experience to point you in the right direction.
- Avoid working with partners who want to "boil the ocean".
After hundreds of deployments and perhaps thousands of interactions with other Microsoft MVPs and Solution Architects, it is 100% clear that the best strategy for Microsoft Dynamics 365 or CRM deployments is a phased approach. Start small and grow the footprint of the solution within the organization over time. This allows the team to learn valuable lessons along the way and adjust if necessary in a constant evolution of deployment success.
- Avoid working with partners who are incompatible with your project commitments and expected business outcomes.
This actually goes both ways. You don’t want to work with a partner who keeps you in the dark with the big decisions and does all the work without involving you because it's "faster and easier." If do you want to be involved with the delivery team or the deployment itself, then you should absolutely work with a partner who will involve you in the process, as we do here at Elev8 Solutions. However, if you want a partner that can take the wheel and make the decisions your input couldn't influence anyway, then you should find and work with a partner who can support you in that way to best meet your needs.
So, where do I go to find the right partner?"
Seek out the advice from a Microsoft Sales Professional (MSP). These MSP’s know and work closely with many partners and are acutely aware of who would be the best fit for your organization based on what you need to get out of Microsoft Dynamics 365, your industry, and budget. In addition, conferences and local events give you an excellent opportunity to not only learn from experts while you are there, but also to interview potential partners. If you don't have the ability to attend one of these large conferences, look for local meetings. The CRM User Group has dozens of local chapter meetings all around the world, you can simply visit CRMUG.com and find a local meeting to attend and learn alongside other users.
Want to learn more from Gus about choosing the right partner? Listen to the full episode at http://crmmvppodcast.com/or subscribe on iTunes. Please take a second to leave a review and follow us on Twitter for new episodes or to suggest topics for future episodes.
Are you ready to take the next step? Contact Us to find out why Elev8 Solutions is the preferred partner for organizations seeking total CRM success.

The CRM Chart Guy: Analytical Options in Microsoft Dynamics 365
Introduction
Dynamics CRM and now Dynamics 365 have always had analytical features enabling the users or administrators to create visualizations of their data to gain better insights on business data. For a while, the main go to options have been the built-in charts and dashboards, SSRS reporting and of course Excel. However, more and more options and features for analyzing data are starting to appear. Some years ago, the Excel add-ins PowerQuery and PowerPivot started adding more options, and now the Power BI Desktop application and PowerBI.com have extensive analytical and reporting capabilities on the Dynamics 365 data. Power BI dashboards and Power BI tiles can even be integrated in to Dynamics 365.
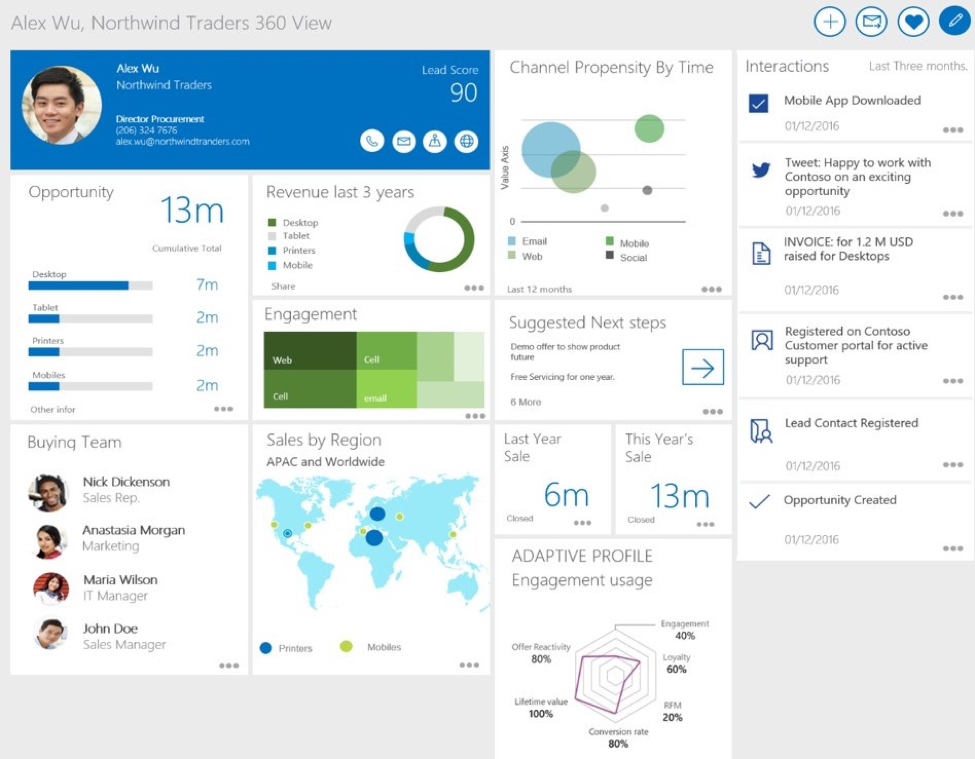
With the latest release of Dynamics 365 comes a new option called Customer Insights. Microsoft has shown some demos of this very powerful analytical tool and how it can create KPIs on customer data and show the KPIs specific to the customer record that you are looking at, something that Power BI specifically cannot do. Customer Insights drives the Relationship Analytics capabilities that were previewed during the recent announcements of Dynamics 365, giving users visual insight into the relationship health of an opportunity, all based on related activities and recency.
Each of the different options: Power BI, Customer Insights, and Charts and Dashboards have their target purposes as well as pros and cons. We will try give you an overview of the different options and the areas that are worth considering when using them with Dynamics 365.
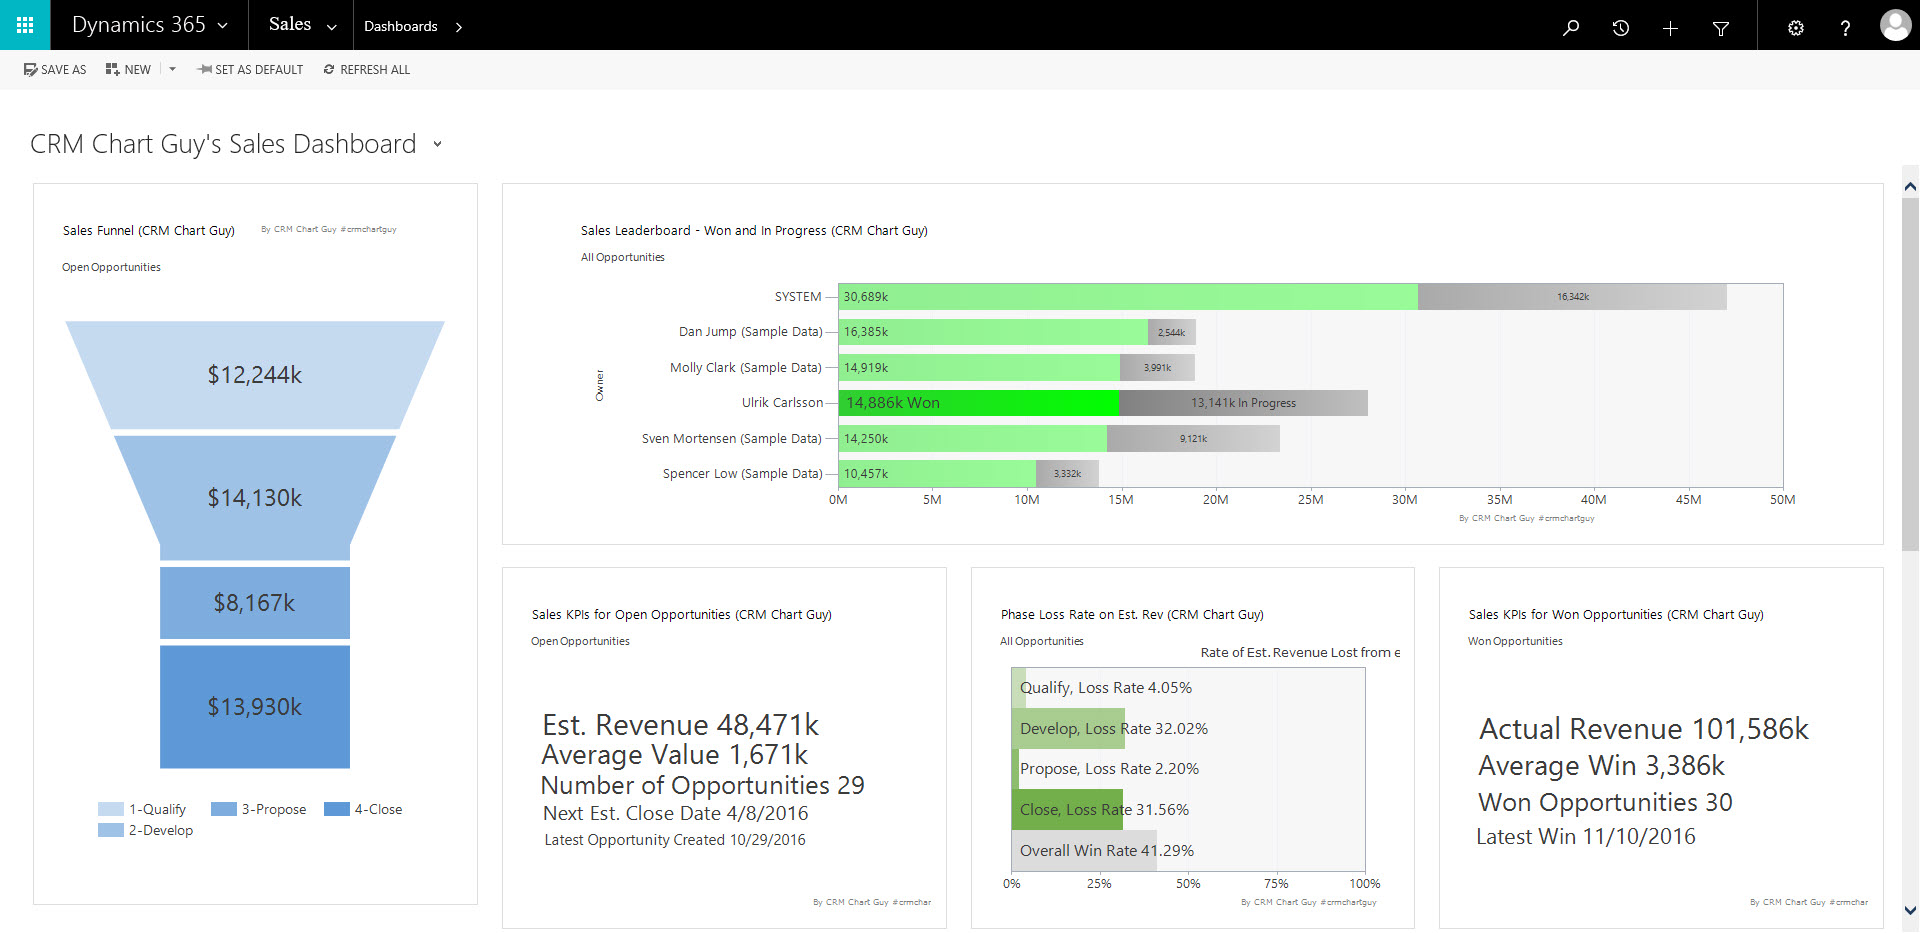
Standard Sales dashboard displayed in Dynamics 365
Power BI
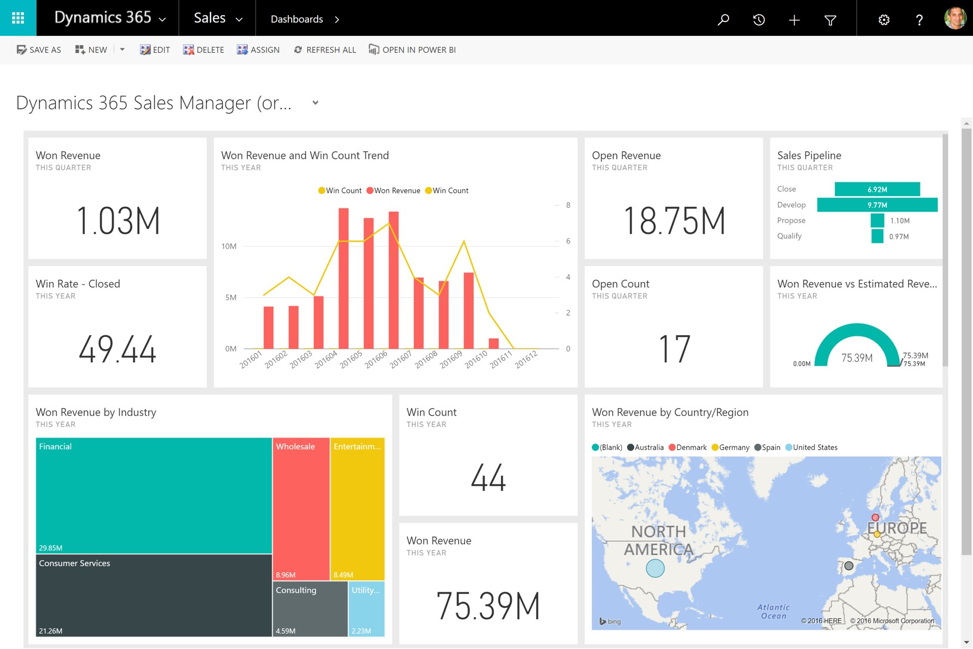
Power BI dashboard displayed within Dynamics 365
Power BI has proven to be a robust analytical tool that is being updated at breakneck speed. Significant feature improvements are literally coming to the desktop application monthly. It excels in modeling data and combining data from multiple sources and joining them in to one comprehensive report.
The “integrations” with Dynamics 365 have gotten tighter and you can now display full Power BI dashboards within Dynamics 365 and add individual Power BI tiles on user created dashboards.
While featuring powerful drill-down features on the data in the visualizations, there is no direct record access from the Power BI components. i.e. you can’t drill down to a case and then click the case to work on it.
Power BI’s connection to Dynamics 365 respects the security privileges of the user creating the report. That user can then share the report with other users, even if those users do not have access privileges to the data used. Reports then can be shared with the only the appropriate individuals. Power BI Pro does offer extra features for RLS (Row Level Security), so some security can be imposed on the data within the reports. However, RLS is managed separately in Power BI Pro and is not integrated or synchronized with Security Roles in Dynamics 365.
Power BI’s main role is as an executive reporting tool, giving significant insights on all the business’ data sources.
Customer Insights
Customer Insights, and its more advertised sub-feature Relationship Analytics, is an Azure based analytical solution. In Customer Insights, administrators can create KPI’s and insight panels for various customer profiles. The concept is that the Customer Insight charts and KPIs, as well as Relationship Analytics, is viewed in context of a specific profile. That profile can be a Contact, Account, Lead, Opportunity or another custom entity.
The Customer Insights hub is set up and managed in Azure and can pull data from Dynamics 365 or Azure Blob Storage. More options for sources will be added in coming releases. The data and the KPIs is then updated every 15 minutes.
These Azure Customer Insight components can also be added to the forms in Dynamics 365, giving you KPIs in context of the customer.
As Customer Insights resides in Azure, a subscription is required and the Customer Insights does come at an additional cost. At the time of writing, the cost USD 250.00 per month for up to 1 million interactions and 100,000 profiles.
Customer Insights panel shown on the Customer Insights application
Charts and Dashboards
Last, but certainly not least, charts and dashboards are still available in Dynamics 365 for real-time ad-hoc reporting and dashboard creation at the user level. Outside of a few minor bug fixes, the charting features have not really been updated at all in the past few years. This is of course unfortunate as it is a very powerful analytical tool. Users can also edit the chart xml to achieve more advanced KPIs than they can with the built-in chart editor. However, charts are limited at 50,000 records and queries are also somewhat limited by the capabilities of the fetchXML. Charts are also limited to only access data within Dynamics 365. Outside of the most standard count, sum, average, and min/max calculations, charts tend to come up short and will likely need to take advantage of calculated fields or roll-up fields in Dynamics 365 to do more complex analytics. This is something that Power BI can do without having to make changes to the data structure, although charts also covers the most common options.
Charts still have some big advantages over the other analytical options. Specifically, they are real-time and offer drill-down capabilities with direct access to the underlying records. In service management where meeting tight SLA requirements is a necessity, the ability to click through a chart to the most relevant cases and then directly work on it from there is a major advantage. Since charts are using fecthXML, or “Views” in Dynamics 356, the data is also contextual to the user that is logged in, showing them only the data needed at a given time. You can also add charts to forms, for contextual analytics relevant to the record you are viewing. This is like Customer Insights, but without the need for an Azure subscription.
Comparison Overview
The CRM Chart Guy has created this helpful matrix to give an overview of some of the features and benefits of each solution:
| Feature | Power BI | Power BI Pro | Customer Insights | Charts |
| Contextual to Record/Add to Form | No | No | Yes | Yes |
| Data Contextual to logged in User | No | No | No | Yes |
| Drill Down | Yes, but no access to CRM records | Yes, but no access to CRM records | Yes, but no access to CRM records | Yes – with access to CRM records |
| Geo-Coded Data/Maps | Yes | Yes | Yes | No |
| User Sharing of Content | Yes, through Power BI*1 | Yes, through Power BI*1 | No | Yes, in CRM |
| Azure Required | No | No | Yes | No |
| Respects CRM Security Roles | No | No, but have RLS – Row Level Security *2 | No, managed through Roles in the Customer Insights hub on Azure | Yes |
| Data Refresh | Daily | Hourly (up 8 times a day) | 15 minutes*3 | LIVE |
| External Data | Yes | Yes | Yes*4 | No |
| Record/Size Limit | 1GB per User | 10GB per User | Depends on subscription (see cost) | 50k records |
| Admin or User setup | User | User | Admin | User or Admin |
| Cost | Free | USD 9.99/month/user | USD 250.00 per month for up to 1 mil interactions and 100k profiles | Free |
*1 Sharing Power BI reports and dashboards happens through Power BI. If adding Power BI tiles to a User dashboard in Dynamics 365, both the Dynamics 365 dashboard and the Power BI dashboard must be shared with the other Users. Power BI Tiles and Power BI Dashboards cannot be included in System Dashboards in Dynamics 365.
*2 All security is handled through Power BI. A user can grant another user access to reports containing data the recipients do not have access to in Dynamics 365. RLS, Row Level Security, is for Power BI Pro only and is managed separately in Power BI.
*3 Azure Customer Insights hub imports a delta every 15 minutes and recalculates the KPIs and visualizations.
*4 Azure Customer Insights hub currently only supports Dynamics 365 and Azure Blob Storage. More data sources will be added later.
How to Choose?
Between Power BI, Customer Insights and the built-in charting engine, Dynamics 365 offers some wildly powerful analytical options, each with their own set of advantages. Which one should be your go-to analytical tool depends on your business requirements and in which context the information will be consumed. They are all separate tools and there is no reason you cannot or should not take advantage of all three at the same time.
It may also be as simple as what you have access to. Customer Insights has the highest learning curve of the three options and requires you to set up and pay for an Azure service as well. Power BI, with the free version being available to most users still requires some setup and training would be recommended if you want to take full advantage of the features.
Charts are accessible to all users and everyone can save and share their own charts with other users or teams. Users can even export the chart xml, make modifications and import them back in to the system without needing a System Administrator. Of course, modifying the chart xml may not be for everyone, but plenty of step by step instructions can be found at www.crmchartguy.wordpress.com
Analytic options for Dynamics 365 are evolving and the options described above change with every release. For the time, it seems clear that Microsoft is putting the development resources into analytical tools outside of Dynamics 365. Both Power BI and Customer Insights work by taking the data out of Dynamics 365, manipulate it, generate the reports and then display it back either inside or outside of Dynamics 365. The charts that work entirely within Dynamics 365 have not been updated for a long time. This is unfortunate, as the .Net based charts have many more options and features than the chart editor gives you. Minor updates in this area could have significant leaps in the feature set. Although, it does make sense for Microsoft to invest in tools and solutions that work across multiple LOB applications, rather than just within Dynamics 365.
Are you ready to see where digital transformation with Dynamics 365 can take you? Contact us today to find out.

The CRM Chart Guy: Case Accountability
Case Accountability with Queues
Cases and Queues tend to go hand in hand in MS Dynamics CRM. It is a great concept that you can route cases of a certain type to a designated queue, where specialized workers can pick the case and start working on it. One of the most important disciplines in case management, is establishing clear accountability on every case at all times. There should not be any discussion or ambiguity as to who’s got the ball at any given moment. This is where queues have a few pitfalls and challenges that implementers should be aware of when establishing processes.
How do queues establish accountability?
Queues use a Queue Item for every case that has been routed or added to a queue. The queue item includes a “Worked By” field to identify if anyone, or who is working on the item. When a queue item is picked, or routed to a user or team, the queue item remains, and the Worked By is updated the User or Team. In addition, the Case is assigned to the User or Team it was routed to. If a queue item is released, the case is assigned to the Owner of the queue. Which can be either a user or team.
In this context, most of the actions around queues, populates the “Worked By” field AND assign the case to the same User or Team. This implies that “Worked By” and Case Owner are in synch and there is only one responsible entity. It is clear who is accountable. However, one of the before mentioned pitfalls occur when a queue item has been routed to a User or Team, and afterwards the case is assigned to somebody else. In that scenario, there is now a mismatch between “Worked By” and Case Owner and a great opportunity to have a case fall between the cracks.
Queue Actions |
Worked By |
Case Owner |
Owner/Worked By Match |
| Route to User or Team | Sets to User or Team | Assigns to User or Team | In Synch |
| Pick | Sets to Self | Assigns to Self | In Synch |
| Release w Worked By | Clears Worked By | Assigns to Queue Owner (User or Team) | n/a |
| Remove | Deletes queue item | No change | n/a |
Case Actions |
|||
| Assign with no Worked By | n/a | Assigns to User or Team | n/a |
| Assign with Worked By | No Change in Worked By | Assigns to User or Team | Risk of Mismatch |
Routing to a Queue
You would assume that routing or adding to a queue would always have the same action. This is not the case. If a queue item has “Worked By” populated and you from the case form add the case to another queue, the user defined in the Worked By remains. Same if you apply a routing rule and it runs automatically. However, if you from the list of queue items, also select the “Route to Queue”, the “Worked By” field will be cleared and whoever was responsible, is no longer responsible.
Adding or Routing to a Queue |
Worked By |
Case Owner |
| Add to Queue from Case form | n/a | No Change |
| Route to Queue from queue list | n/a | No Change |
| Route to Queue with Worked By | Clears Worked By | No Change |
| Route via Routing Rule with Worked By | Worked By remains the same | No Change |
| Add to Queue with Worked By | Worked By remains the same | No Change |
Some Queue Pitfalls
Queues has a few pitfalls and quirks that are worth being aware of when designing and implementing case management. We will go through those items one by one:
- Queue Items not visible directly on the Case form
- No warning when routing to a new queue and removing from the existing queue
- No Audit History for queues on the Case
- Route to a Personal Queue does not assign the Case
- Reactivating a Case can create multiple Queue Items
- Deleting a Queue Item will delete the Case
Queue Items are not visible on the Case itself
Users cannot see, on a case, or from a case view, which queue it belongs and who may or may not be in the “Worked By”. A User would have to open the case and click on the “Queue Item Details” button to see the information.
No Warning When Routing to a New Queue
While Users do not have direct visibility on the queue details directly on the case form, they can still add the case to other queues. And in doing so, there is no warning to let the user know, that the case is already a member of another queue.
No Audit History for Queues
Queue Items are fleeting records. As soon as a record is removed from one case, the queue item is deleted from the system. You cannot go back and look at the Audit History to see which queue a case has belonged, nor do you have access to any time stamps of when the items were created or had a “Worked By” added. You only have access to the Audit History on the Queue Item if you never broke the chain by removing a Queue Item.
Route to a Personal Queue does not Assign the Record
If you take a case or a queue item and route it directly to an individual If you add something to a user’s individual queue, the case does not get assigned to that individual. The “Worked By” on the queue item will be empty and the case will remain assigned to the current owner. I would have expected an assignment as well since an individual was identified in this process.
Case Resolution and Reactivation can create multiple queue items
When you resolve a case that is in a queue, the queue item will deactivate and remain with the case. However, if you reactivate the case, the queue item will remain inactive. This by itself does not cause any issues, but if the case is then added to another queue, a duplicate queue item will be created. In turn, you will get this error message when trying to view the queue item from the case.
Deleting a Queue Item Will Delete the Case
While you can’t delete queue items from the view, you can delete them when you are in Advanced Find. Handle with care though as deleting a will also delete the case (or other record) the queue item is for. Stick to using the “Remove” button as it will effectively just delete the queue item and not the case itself.
Best Practice on Case Accountability
There are however, methods to get around these pitfalls using simple configurations and workflows. Using lookup fields in CRM to both the Queue and the Queue Item entity, it is possible to leverage workflows to keep these fields updated with the Queue and Queue Item. This will allow you to add details from the Queue and who the “Worked By” is to the case form itself. No additional clicks to get to the information. This will also keep your Audit History for queue movement. In turn, workflows can also be leveraged to keep the “Worked By” and the Case Owner synchronized if that is desired.
Lookup fields to both Queue and Queue Item can also be enabled for auditing making it easier to backtrack what happened in case there are issues. While you cannot use the security roles to stop people from removing Queue Items, real-time workflows can be leveraged for this. Or the Remove button can be removed from the menu. Pun not intended. Workflows can also be used to reactivate a queue item when a case is being reactivated. This will avoid issues with multiple items for one case and will keep the history on the Queue Item as well.
Conclusion
Understanding how queues work and what some of their pitfalls are is extremely helpful during an implementation. At Elev8 Solutions we are happy to help you working with queues and have years of expertise in establishing proper accountability for your cases and ensuring proper follow through.
Are you ready to put these Expert Insights to work in your Dynamics CRM environment? Contact us today for a free demo or business assessment.
Elev8 CEO Gus Gonzalez receives 2016 CRMUG Granite Partner Volunteer Award
October 13th, 2016
Elev8 Solutions' CEO and leader, Gus Gonzalez has received the 2016 CRMUG Granite Partner Volunteer Award. Today at the CRMUG Summit General Session, Gus was recognized for his incredible contributions in building a strong and valuable CRMUG community.
Gus Gonzalez is a 5-time Microsoft MVP, CRMUG Granite Partner, and leads the vision, growth, and strategic direction at Elev8 Solutions. He has 15 years of consulting experience in the IT Industry, designing and implementing Microsoft Solutions ranging from enterprise to small environments.
A world-class trainer and readiness expert, Gus has a passion for creating solutions that organizations can count on, and users love working with. His highly successful immersive style of consulting and training has been forged over years and countless hours of working with customers getting the most of Microsoft Dynamics CRM
Want to work with us? Check out our Careers page for more info

Custom Date Formats in Microsoft Dynamics CRM Charts
The CRM Chart Guy: Custom Date Formats in Microsoft Dynamics CRM Charts
Dates in Dynamics CRM charts generally follow the date settings you have set up in the system settings of CRM. However, there are often situations where you might to present the date in a different format or leave out specific data that may not be needed.
One example is when a user is grouping a chart by week. Normally, Dynamics CRM would have a label such as “Week 45 of 2016”. This particular format of week numbering is actually not that common in some regions - particularly the US, where utilizing this date format may lead to some confusion. Rather, a date format such as: “Week of Sep 13” would be preferred.
Take a look at this example:
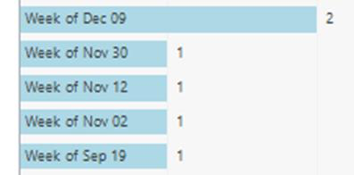
When the date is the label of a data point in the chart, it is possible to use date formatting features in the .NET charts that the CRM charts are based. It is unfortunately not possible to change the label when it is on an axis.
In the example above, we used LabelFormat=”’Week of’ MMM dd” in the chart xml to set the desired label. MMM specifies that we want to write that month in a three letter abbreviation and dd gives us the day of the month in two digits. We could have used “MMMM” to spell out the whole name of the month, but that would not have been suitable on this chart where space is limited.
To read full step by step instruction on how to change the label, get more details on your formatting options, and how to work around the access issue, check out the CRM Chart Guy’s blog here: The CRM Chart Guy: Custom Date Formats in Microsoft Dynamics CRM Charts